Welcome to Data Dispatch
Where all things data are dispatched directly to you.

Welcome to Data Dispatch, a weekly digest of interesting data analysis, data news, data visualizations, and even some samplings of my own work—delivered right your inbox!
I love data, and am passionate about good data visualization. I created this newsletter as a creative outlet for myself, and as a way to share my passion with others. For this first edition, I wanted to share a little about myself and how I got into this industry.
About Me
After studying art history and studio art at Wellesley College, I spent over a decade working for various non-profit organizations in fundraising and marketing. I wrote grant proposals, solicitation letters, met with major donors, and crafted marketing campaigns. I developed many skills (particularly problem solving, writing, communication, and the art of persuasion) that I still use today in my current career as a data analyst.

I went back to school in 2021 to study data analytics at the Roux Institute, with the ultimate goal of changing my career path. I graduated this past June, and am now a professional data analyst, data visualization enthusiast, and passionate Tableau practitioner.
What better way to tell you about myself in a newsletter about data than through a few data visualizations? I’ve lived in a few different places in my life, each representing a different chapter or part of my life. So that’s the focus of these charts—where I’ve lived, and for how long. All these charts were made in Tableau.

Above is a basic timeline chart, which I’m sure you’ve seen in many history books. This chart is my history—it includes when and where I was born (Maine, 1987), and everywhere I’ve lived since then. It brings you to today, where I still live in Massachusetts with my partner, two sons, one stepson, and two dogs.

This horizontal bar chart is another way to represent the same data. However, instead of representing it in a linear format, you can easily see the amount of time (in years) spent in each location, sorted from most time to least. It’s funny to think about how I’ve still lived the most time in Colorado. It was where I grew up, but I’ve lived so much life since leaving when I was 18.

And finally, in stacked bar chart form, is yet another way to visualize this data. This particular chart shows the data in a normalized state—instead of using the actual numeric values for years, I have included time spent in each location as percentages of a whole. Now you may be wondering, “Why didn’t you use a pie chart?” This is a no pie chart newsletter. I will explain why in a future post!
Thanks for reading and following along with me on this journey! I look forward to sharing more visualizations, data tips, and insights from the field of data visualization. I’m happy you’re here!
Tiny Dispatch
Quick data tips, data news, and data insights.
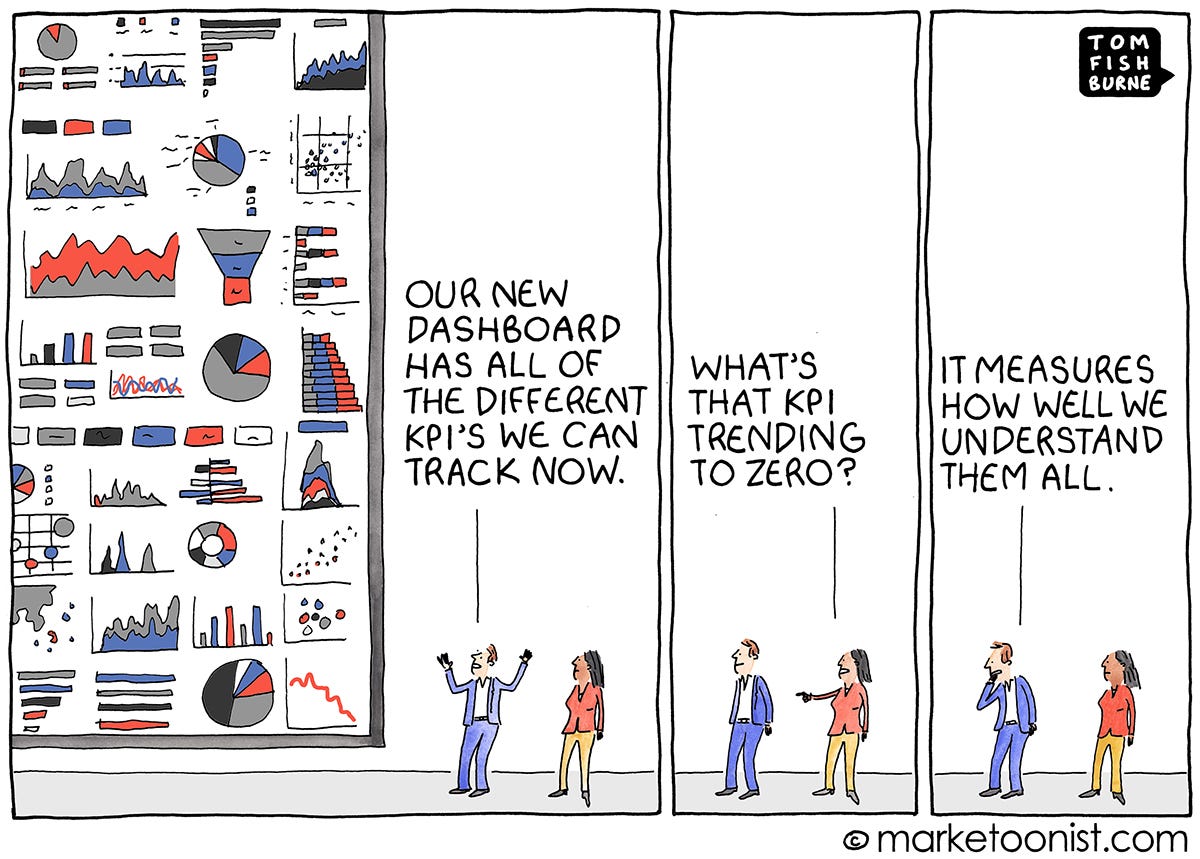
Good data visualization is like good design: it should be useful and easy to understand, first and foremost. After all, what use is a lot of data if you don’t know what to do with it?